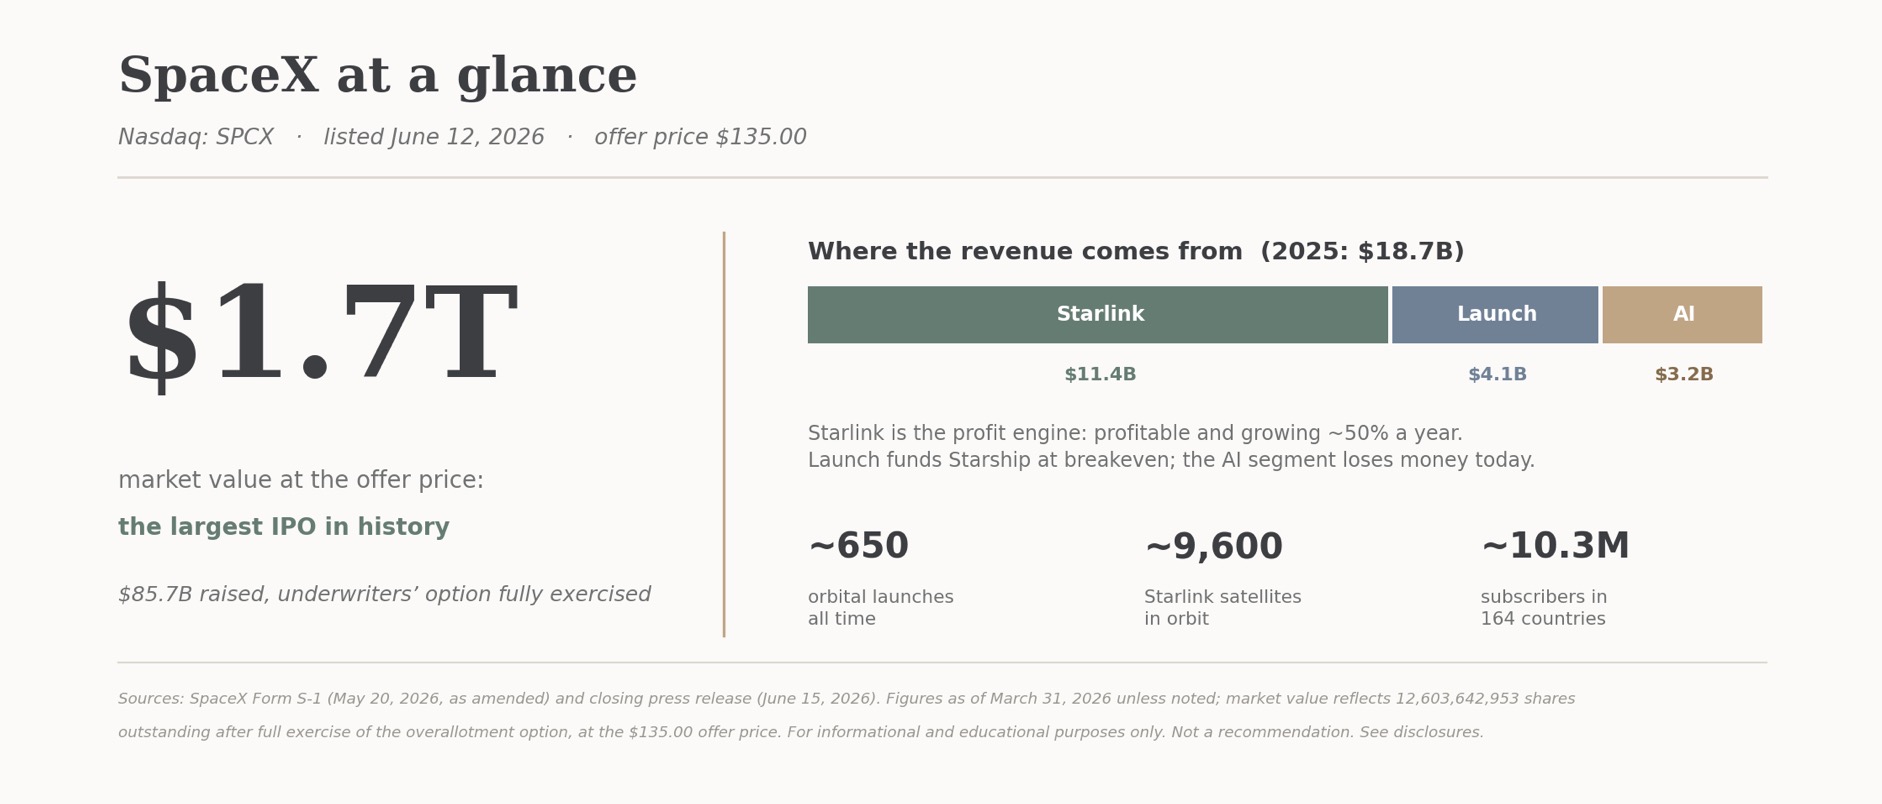
In June 2026, SpaceX went public in the largest initial public offering in history. At its $135.00 offer price the company came to market valued at roughly $1.7 trillion, raising about $85.7 billion in a single stroke, the underwriters exercised their full option for additional shares. For the first time, ordinary investors can own a piece of a company most of us have watched with fascination for two decades.
A quick picture of what public investors are buying. Founded in 2002, SpaceX is a vertically integrated hardware-and-software company operating across three areas: rocket launch, the Starlink satellite-internet network, and, since an early-2026 acquisition, an artificial-intelligence business built around the Grok model and the X platform. The launch business is the foundation. Its reusable rockets have opened a cost advantage that competitors have not matched, and the company launches the large majority of the world’s payload mass to orbit each year.
The financial engine, though, is Starlink. Of roughly $18.7 billion in 2025 revenue, about $11.4 billion came from Starlink, at a healthy and fast-growing margin, serving more than ten million subscribers across 164 countries. Launch is large and strategically central but roughly breakeven as it funds the next-generation Starship vehicle. The AI segment is growing quickly but loses substantial money today. Altogether SpaceX represents the combination of a proven, profitable connectivity business wrapped around an audacious launch operation and a capital-intensive AI moonshot.
The enthusiasm is understandable. Investors are being offered, for the first time, public access to a genuine category leader with a real moat, led by a founder with a record of building epochal companies. And SpaceX is not alone at the door. After years of a quiet IPO market, the marquee names are lining up again: names frequently mentioned as potential future offerings include Anthropic, Anduril, Databricks, Discord, Kraken, Perplexity, and Revolut, alongside the most watched of all, OpenAI. The retail IPO market is back, and for the first time in years clients are calling to ask, “how do I get a piece of the next one?”
It is a fair question, and an old one. There is a powerful pull to the IPO. It feels like the ground floor, the chance to own the next great company before the rest of the world catches on.
I want to be clear from the outset, because the rest of this piece is going to strike a cautious tone and I don’t want to be misunderstood: great companies almost always make great investments. Some of the finest businesses of our lifetime came public and went on to reward their shareholders enormously. Meta is the quintessential posterchild. The problem is not that winners do not exist. The problem is that they are rare, they are hard to identify in advance, and, as we will show, the reward went almost entirely to the investors who were selective about which ones to own and then had the patience to hold them for years. Buy the excitement of the average IPO on its first day and the odds are simply against you. That distinction, between the rare great outcome and the average one, is what this paper is about.
There are far fewer public companies than there used to be. The number of U.S.-listed companies fell by roughly half between 1996 and 2020, from more than 7,000 to fewer than 4,000. The public market, the thing most investors think of as “the stock market,” has been quietly contracting for a generation.
At the same time, the companies that do go public are showing up much later in life. Drawing on data from Professor Jay Ritter at the University of Florida, the definitive academic source on IPOs, the median company going public in the early 1980s was about six to eight years old. Through the dot-com boom of 1999, that median briefly fell to just five years; companies raced to the public market almost as soon as they were born. Today the median IPO is a mature adult, roughly twelve years old.
Exhibit 2. The beginning keeps starting later: median age of U.S. companies at IPO. Source: Prof. Jay R. Ritter, University of Florida; chart popularized by Torsten Slok, Apollo.
The same story is sharper if you narrow the dataset to the venture-backed technology companies that generate the most investor excitement. In the 1990s, roughly 94 such companies went public every year. In the 2020s, that pace has collapsed to about 24 a year, and the ones that do list are twice as old as their 1990s counterparts.
Exhibit 3. Fewer doors, opened later: VC-backed technology IPOs per year and median age, by decade. Source: Ritter (Table 4i), as presented by VanEck.
Why does this matter? Because a company’s most explosive growth tends to happen early. If companies now spend twelve years growing up in private hands before they list, then the years of fastest value creation, the part every investor wants to own, are happening somewhere you and I cannot buy.
For most of modern financial history, the deal was straightforward. A promising company went public relatively early to raise money for its next phase of growth, and public shareholders, ordinary investors, rode the expansion alongside the founders. The IPO was the on-ramp.
Exhibit 4. The IPO used to be the on-ramp. Now it is the exit. Illustrative; framing adapted from Manhattan West.
That deal has changed. There is now so much private capital available, from venture funds, growth equity, sovereign wealth funds, and crossover investors, that a company can raise billions and reach enormous scale without ever touching the public market.
It was not always this way, and the difference is worth pausing on. Consider the tech bellwethers of the last generation: Amazon, Google, and Facebook. Amazon came public in 1997 valued at well under half a billion dollars. Google listed in 2004 at roughly $23 billion. Nearly all of their expansion, the scaling, the compounding, the trillion-dollar climb, happened as public companies, with retail shareholders along for the ride. Even Facebook, which stayed private eight years and arrived in 2012 already valued around $104 billion, an early sign of the shift we are describing, went on to compound more than tenfold in public hands.
Today’s giants are running the opposite path. Not only are companies staying private far longer, they are being marked up round after round, at ever-larger valuations, while they are still private. The growth still happens. It just happens on cap tables you and I are not invited to join. By the time the company finally lists, much of the juice has already been squeezed out of the lemon, and what reaches the public investor is a more mature, more fully-priced business. The IPO functions less as a fundraising on-ramp and more as an exit, a liquidity event for the insiders and early investors who captured the climb.
There is no better illustration than the company whose bell just rang.
Exhibit 5. The climb happened in private: SpaceX valuation by round, 2002 to 2026. Source: EquityZen (Morgan Stanley); S-1 and closing release for the IPO value.
SpaceX was valued at roughly $27 million in 2002. It went public at roughly $1.7 trillion in 2026. That is a staircase climbing more than sixty-thousand-fold, and here is the point that matters: every single step of that climb happened in private. The venture investors, the growth funds, the sovereign wealth funds, and the employees with equity captured essentially all of it. Public investors were not invited until the very last step, at the very top of the staircase. The same is true of the AI giants waiting in the wings. By the time OpenAI or Anthropic ring the bell, the journey from nothing to hundreds of billions will already be complete.
To be sure, SpaceX has a tremendous operational runway in front of it; that isn’t the question. Rather, the question is whether SpaceX’s best returns are ahead or in the rear-view mirror. None of this is a scandal, and the insiders are not doing anything wrong. Venture funds have a finite life, typically about ten years, and a legal obligation to return capital to their own investors. They are structurally required to sell at some point, and the IPO is the natural moment. They are not “dumping” a company they have lost faith in; they are distributing shares on a clock that has nothing to do with the company’s prospects. But the effect on you, the public buyer, is the same either way. The most informed owners in the company’s history are handing you the shares on the day you are finally allowed to buy, and they have already collected most of the reward for the risk they took early.
This is the analytical heart of the piece, and it is where we can replace intuition with evidence.
We studied the record of major U.S. IPOs from 2006 through 2026: every traditional listing above $500 million in size, excluding blank-check SPACs, REITs, royalty trusts, and closed-end funds. That is a universe of roughly 320 companies, and critically, it includes the ones that failed and disappeared, not just the survivors. From that universe we then looked closely at a curated set of 41 marquee names, the household, retail-facing deals an individual investor would actually have been tempted to buy: Meta, Uber, Airbnb, Robinhood, Snowflake, Coupang, Rivian, and the like. A short note on that choice appears at the end of this section.
The pattern is remarkably consistent, and it has a shape. Call it pop, then drop.
Exhibit 6. Pop, then drop: the 41 marquee IPOs, average cumulative total return vs. the S&P 500 over identical windows; acquired names measured through exit. Source: 1900 Wealth analysis of Bloomberg data.
On day one, the average marquee IPO popped about 34% from its offer price. One month in, it was up roughly 36% while the S&P 500 had barely moved. If that were the whole story, the IPO enthusiasts would be right. But watch what happens next. By six months the index had already caught up and passed the group, and it never looked back. By three years the marquee names were down about 14% on average while the S&P 500 had returned roughly 40% over the same windows, a gap of more than fifty percentage points. Measured over their whole public lives, the average marquee IPO returned about 67% against roughly 191% for the index, and even that average is flattered by a few huge winners: the median marquee name lost 29%, while the median matched index return was a gain of 144%. Only five of the forty-one, about one in eight, beat the market at all.
The pop is real. The drop is just as real, and it arrives on a predictable schedule.
It is tempting to respond, “but what about the big winners?” So let us look at them directly, because they carry the most important lesson in this paper. Of our 41 marquee names, only five beat the S&P 500 over their entire life as public companies.
Exhibit 7. The five that earned it: marquee IPOs that beat the S&P 500 over their public life. Source: 1900 Wealth analysis of Bloomberg data. Dagger denotes measurement through exit.
Five out of forty-one. But do not read that as “IPOs never work.” Read it as “the winners were real, and they were rare, and here is what they had in common.” Two things, and both cut against instinct.
First, they looked boring on debut. On their first day of trading, those five winners were, on average, roughly flat, and three of the five actually fell or went nowhere. Meanwhile the full group of 41 averaged a first-day pop of about 34%. The loudest debuts mostly belonged to the companies that went on to disappoint; the eventual champions were quiet on day one. The excitement and the outcome were, if anything, inversely related.
Second, they rewarded persistence, not timing. Meta is the clearest example. It traded below its $38 offer price for more than a year after its 2012 IPO. The investors who bought the hype on day one sat underwater for a long time. The investors who bought quietly, or simply held through the disappointment, were eventually rewarded with a return that compounded at nearly 22% a year. The market did not crown Meta at its debut. It took years, it took conviction, and it took patience.
Great companies can be great investments, but you have to pick the right one out of a crowded field where most disappoint, and then you have to stick with it through the stretch where it looks like a mistake. Selectivity and persistence. Neither is easy, and the first-day buyer usually has neither.
For completeness, here is what happened to the other 36.
Exhibit 8. Everyone else: the 36 marquee names that trailed the index. Big figure is lifetime annualized return vs. the S&P 500; strips show cumulative 12- and 24-month over/under. Source: 1900 Wealth analysis of Bloomberg data.
Some were disasters from the start. More instructive are the ones that looked like triumphs first. Zoom was up more than 300% at one point in its first year and more than 750% inside two years, and still finished behind the index on an annualized basis. Peloton, Chewy, and others show the same head-fakep. Several of these companies were acquired or taken private before their story finished. The graveyard of “can’t-miss” IPOs is crowded, and it is full of names that were once as exciting as the ones in today’s headlines.
The 41 names on these pages are not a random draw. We deliberately selected the marquee offerings: traditional IPOs of roughly $750 million or more that led the financial news the week they priced, each seasoned at least three years so the record could mature. That tilt is intentional, because these are the deals an individual investor was most likely to actually buy, which is exactly the question this paper is asking. What the curation does not do is manufacture the conclusion. We ran the same analysis across the full universe of roughly 320 major IPOs, including the ones that no longer exist, and the pattern is the same, milder in degree: a double-digit average pop, the index drawing even by the one-year mark, and fewer than one in five names beating the S&P 500 over their life. The marquee deals popped nearly twice as hard on day one and faded harder afterward. The bigger the spotlight, the bigger the pop, and the harder the fade.
History is one thing; the companies going public right now are another. It is too early to judge the newest listings the way we judge the seasoned ones, so treat this as a preliminary read rather than a verdict. But the early returns rhyme with the history, and they rhyme especially with the private-markup problem we described earlier.
Exhibit 9. The 2025-26 class: actual share prices with the offer, first-day close, peak, and latest marked; percentage changes measured from the offer price. Source: 1900 Wealth analysis of daily pricing (Bloomberg); not yet seasoned.
Consider three recent, celebrated technology IPOs, each of which had been marked up aggressively in private rounds before listing. Figma priced at $33 and soared to $115 on its first day; it now trades around $22. Netskope priced at $19 and now trades near $12. Cerebras, which private investors had bid from a $62 million valuation up to $23 billion before it ever listed, jumped 68% on its debut and has since given all of it back to sit near its offer price. In every case, an investor who bought the excitement of the first day is down substantially, some by more than 80%. The one apparent exception is SpaceX itself, up modestly from its offer, but it is barely a month public and already well off its first-week high. Priced high, bought higher, then the fade. It is the same movie, and we have seen how it ends.
Set the individual IPO against the boring, disciplined alternative most investors already own: the S&P 500. Over the long run the index has compounded at roughly 10% a year, and as we just saw, it beat the average major IPO within twelve months and pulled steadily ahead from there. That alone is a strong argument for the patient investor.
Read that against everything above and the elegance of the structure becomes clear. The index quietly waits for a company to prove, as a public business, that it is viable, profitable, and durable, and only then admits it. It lets the unproven newcomers list, fade, and sort themselves out, and it buys the survivors after they have demonstrated they belong. It is, in effect, a rules-based discipline that does automatically what most individual IPO buyers fail to do by hand: it is selective, it is patient, and it refuses to pay up for a story until the earnings are real. For a long-term investor, that is not a limitation. It is the entire point.
None of this is a verdict on SpaceX as a company. By any operating measure it is exceptional, and it deserves a fair and balanced look rather than a reflexive thumbs-up or thumbs-down.
The strengths are real and substantial. SpaceX has a genuine moat in rocket launch, where its reusable-rocket cost advantage is years ahead of any competitor, and it operates the world’s only global low-latency satellite-internet network in Starlink. Starlink is the profit engine: it generated roughly $11.4 billion of revenue in 2025 at a healthy margin, growing nearly 50% year over year. This is not a speculative concept. It is a large, profitable, fast-growing business.
But a great company and a great investment at a given price are not the same thing, and the filing itself flags the tensions a patient investor should weigh:
Put together, SpaceX is a superb operating company, a genuine profit engine in Starlink, and a real long-term vision, paired with heavy capital needs, new leverage, breathless strategic change, and an entry valuation that already embeds an enormous amount of that future. And worth noting against the prior section, a company carrying operating losses of this size would not itself qualify for the S&P 500 today on the profitability test, which is precisely the kind of distinction the index is built to enforce.
We promised to answer the question in the title, so here is our honest view, grounded in the evidence rather than the excitement. Can the IPO market create long-term opportunity for the patient investor? Yes, but rarely, and almost never on the day everyone is watching.
The data is not ambiguous. Buy the average marquee IPO at its first-day close and, more often than not, a low-cost index fund would have treated you better within a year. The pop is a moment of maximum enthusiasm and maximum price, and the historical reward for buying that moment has been a fade. Meanwhile companies now stay private longer and arrive richly marked up, so more of the early growth has already been captured before you can participate. And the disciplined default, the S&P 500, not only beat the IPO basket but is structurally built to buy proven, profitable companies rather than unproven stories.
Yet the winners were real, and they teach the way forward. If you are going to own individual IPOs, three principles follow directly from the evidence:
Great companies can be great investments. But the odds of picking one at random are poor, the reward has always favored the selective and the patient, and more of the growth than ever is now captured before the public is invited in. That is the end of the beginning. If a headline IPO has you tempted, that is exactly the conversation to have with your advisor before you act. That is what we are here for.
This material is provided by 1900 Wealth Management, LLC for informational and educational purposes only and represents the views and opinions of the author as of the date of publication. It does not constitute investment, legal, or tax advice, nor an offer or solicitation to buy or sell any security or to adopt any investment strategy. References to specific companies, including SpaceX, Fidelity, and T. Rowe Price, are for illustrative and educational purposes only and do not constitute a recommendation to buy, sell, or hold any security or to pursue any particular strategy, including private-market or pre-IPO investing. Forward-looking statements are inherently uncertain and subject to change; actual results may differ materially. Company valuations, funding-round data, and pre-IPO figures are drawn from third-party sources believed reliable, including SEC filings, EquityZen, PitchBook, and contemporaneous reporting, and have not been independently verified. Historical IPO analysis reflects 1900 Wealth Management’s analysis of Bloomberg data and the IPO research of Professor Jay R. Ritter, University of Florida. S&P 500 index-inclusion criteria are summarized from the S&P Dow Jones Indices U.S. Indices Methodology. Index returns are shown gross of fees, do not reflect the deduction of advisory fees or transaction costs, and cannot be invested in directly. Past performance is not indicative of, and does not guarantee, future results. All investing involves risk, including the possible loss of principal. Data as of June 2026 unless otherwise noted. Please consult your 1900 Wealth advisor before making any investment decision.
For informational purposes only. Not investment advice. See disclosures.
Bobby serves as Chief Investment Officer at 1900 Wealth Management, where he manages a team of investment officers and oversees portfolio strategies for clients. He also develops new business relationships and contributes to firm growth.
A Chartered Financial Analyst (CFA), Bobby previously analyzed fixed-income investments for USAA and its related funds. His career spans capital management, private equity, and financial operations in multiple industries.
Bobby holds a Bachelor of Business Administration in Accounting and Finance from Texas Christian University.